plan-bg-svgPlan hero bg

Gain autonomy over your planning

Deliver informed answers that build consensus and trust to your company’s financial and operational decisions

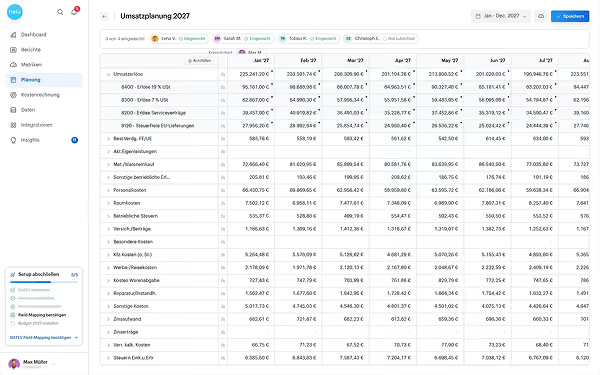
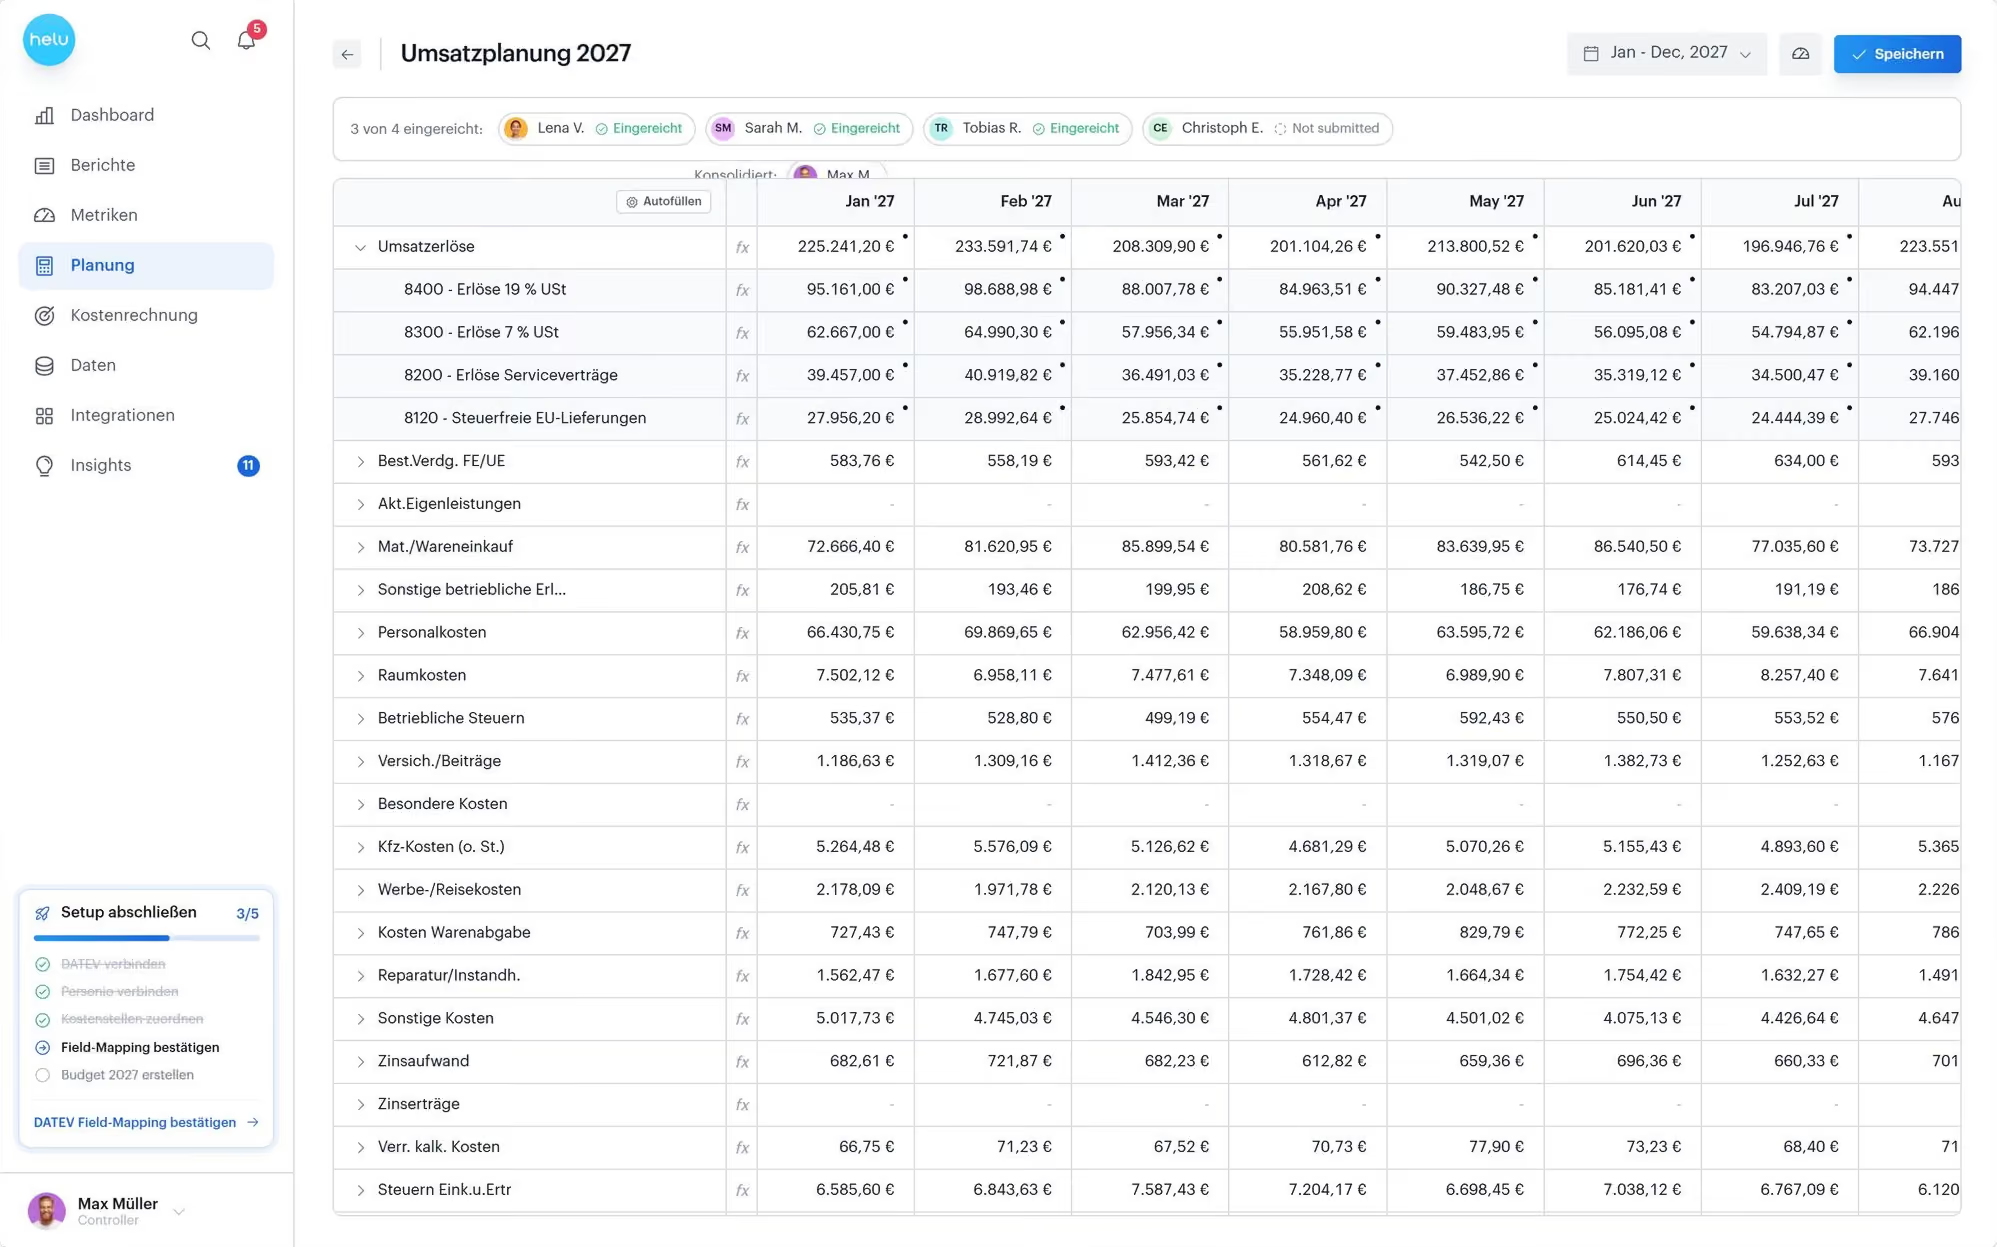
Screenshot of a financial planning dashboard titled 'Umsatzplanung 2027' showing a detailed sales and cost table for Jan to Jul 2027, including revenue from different categories, costs, and taxes in euros, with a sidebar menu for navigation and user profiles displayed.Screenshot of a financial planning software interface showing a Umsatzplanung 2027 (Sales Planning 2027) table with monthly revenue and expense categories for January to July 2027 in euros, including categories like sales turnover, personnel costs, rent, and other operating expenses. The left sidebar has navigation options such as Dashboard, Reports, Customers, and Planning, with 'Kostenrechnung' (Cost Accounting) highlighted. The top bar shows a date selector and a save button.

Full transparency through effective planning

Plan workload and project forecasts in real time—giving you live syncing, multiple scenarios, and reliable baselines.

Minimalist orange stick figure with a circle head and two angled lines forming legs on a white background.

One Value, Two Paths

Fixed number or formula: You decide how a planned value is calculated.

Three horizontal orange rounded rectangles stacked vertically on a white background, resembling a menu icon.

Down to the finest details

A total amount is clearly allocated to accounts, contra accounts, and cost centers.

Two orange arrows forming a diamond shape with a grey horizontal line in the center, on a black background.

From above or from below

Top-down and bottom-up approaches can be freely combined.

CTA-BG

Planning in helu without the guesswork

Plan workload and project forecasts synced live with your actual numbers—giving you complete visibility, flexible scenario modeling, and reliable baselines.

Book a demo
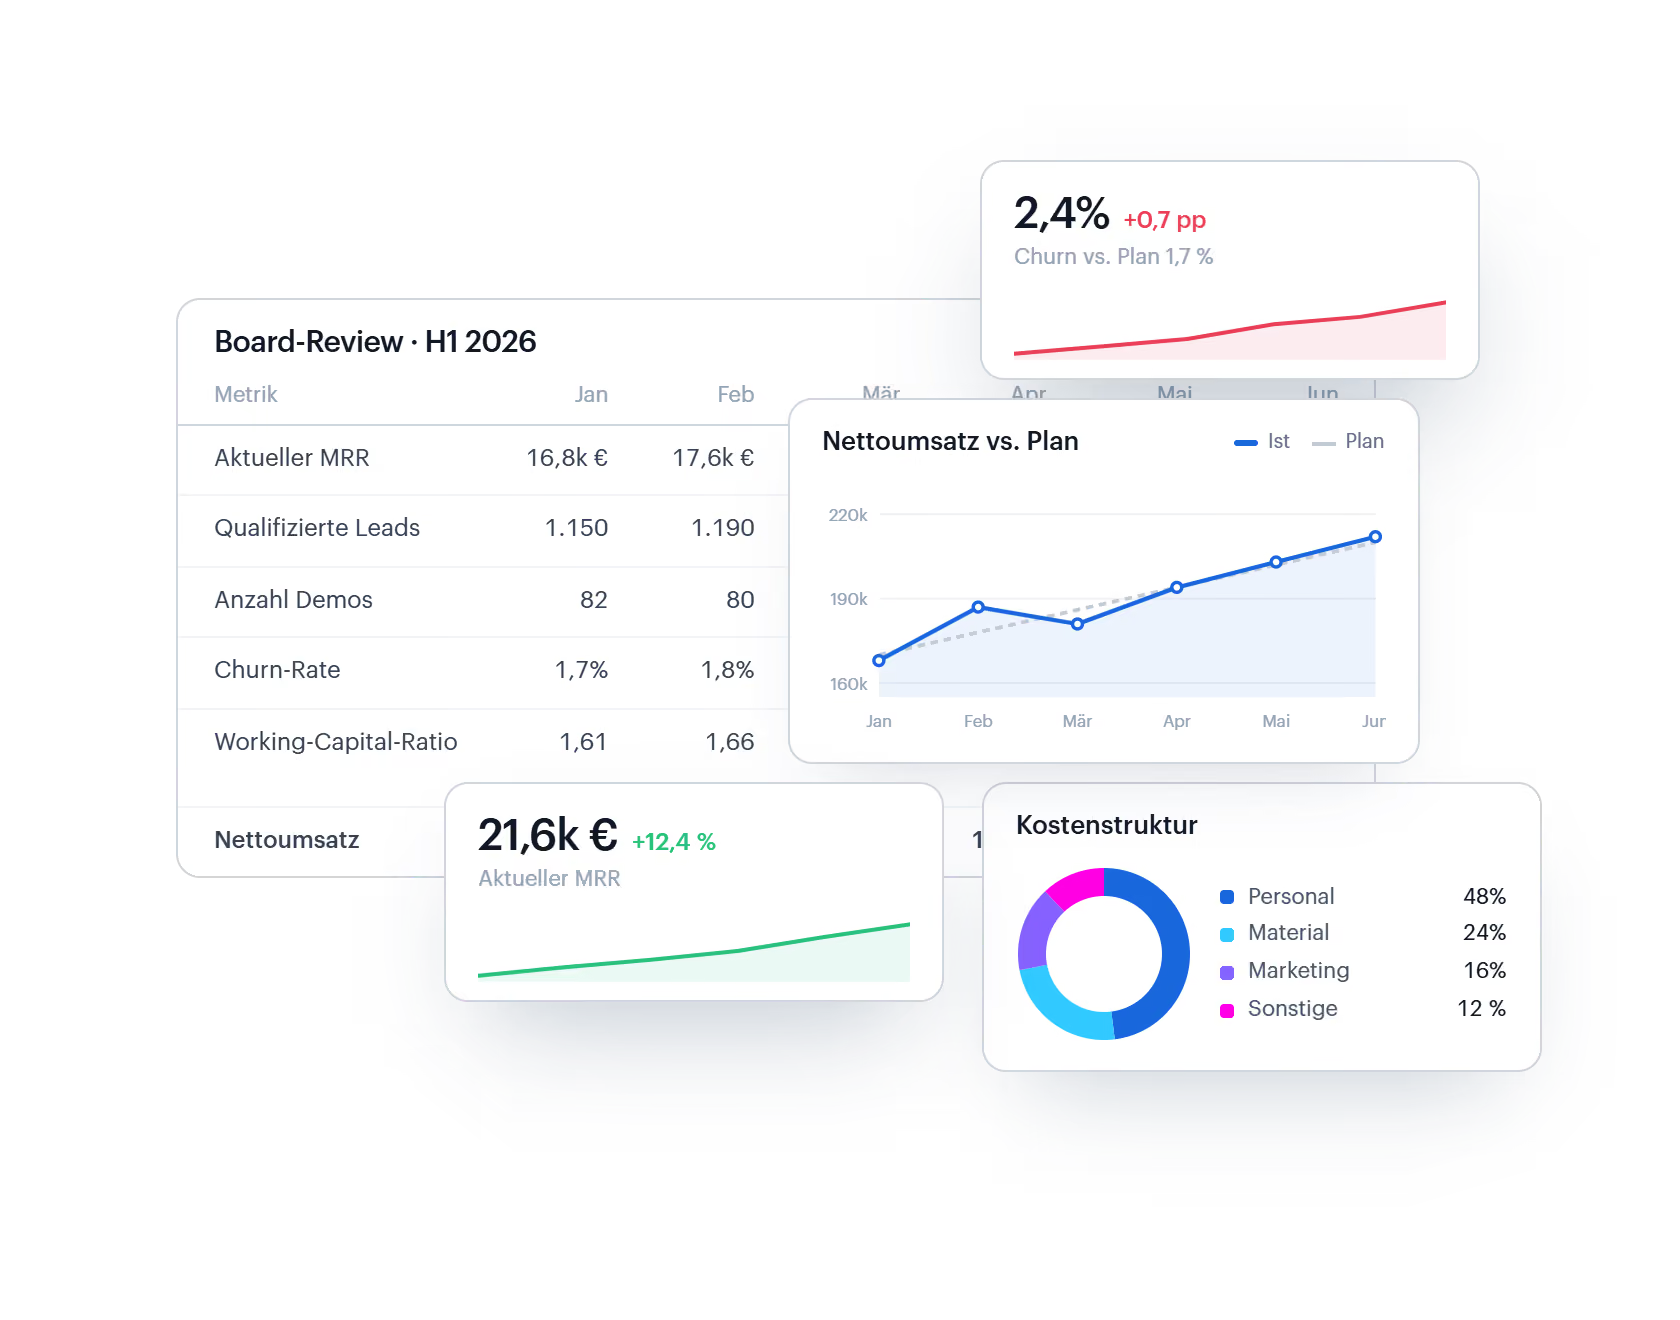
Dashboard showing Board-Review metrics for H1 2026 including MRR, qualified leads, demos, churn rate, and working capital ratio for January and February. Additional charts show net revenue versus plan from January to June, churn rate trend at 2.4%, current MRR at 21.6k euros with a 12.4% increase, and a cost structure pie chart breaking down expenses into personnel (48%), material (24%), marketing (16%), and others (12%).
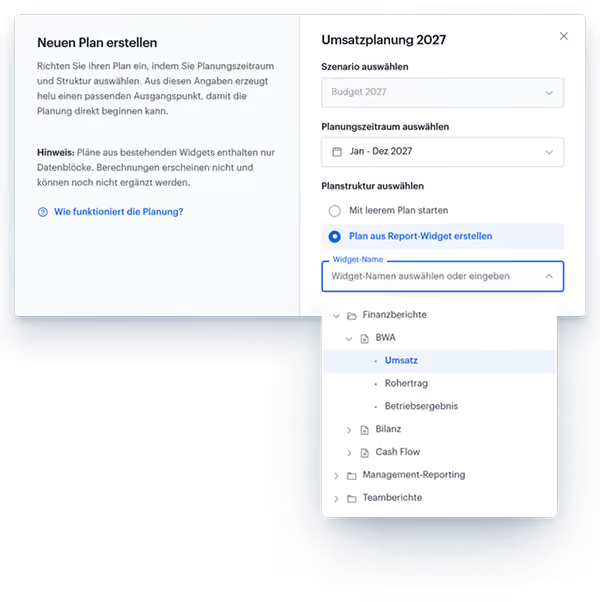
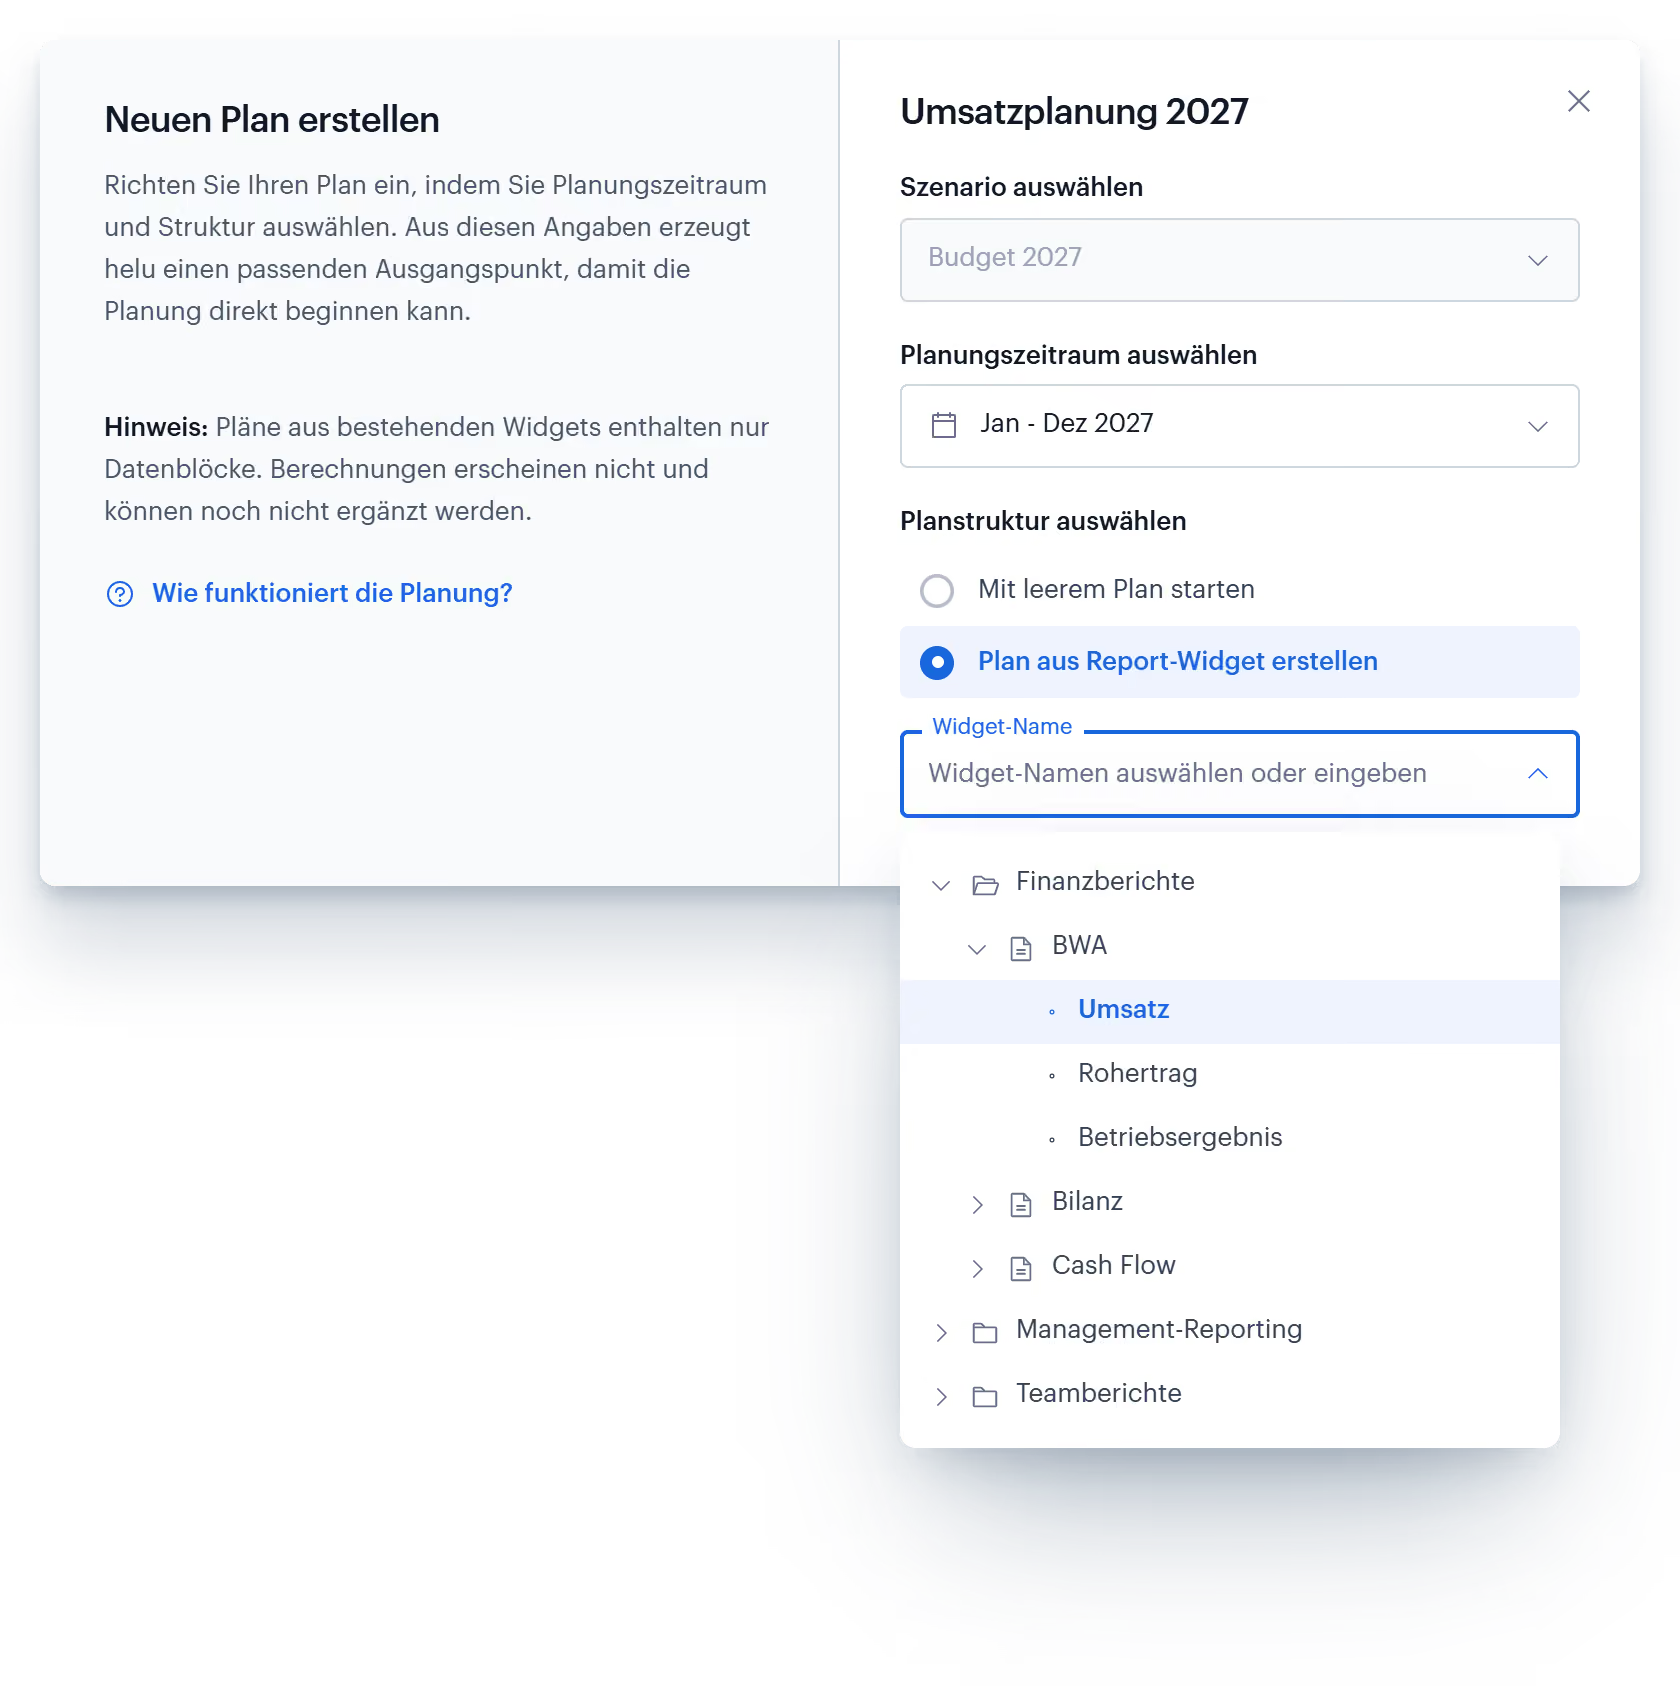
User interface for creating a new plan with options for planning period, structure, and scenario selection. The left panel explains how to create a new plan and notes widgets only contain data blocks. The right panel shows 2027 revenue planning with dropdowns to select scenario budget, planning period (Jan-Dec 2027), and plan structure, including starting with an empty plan or creating from a report widget. A widget name input field is active, showing a collapsible folder list with financial reports, BWA category expanded to show Umsatz, Rohertrag, Betriebsergebnis, and other reporting categories.
User interface displaying a revenue planning setup for 2027 in German. On the left, instructions guide creating a new plan by selecting the planning period and structure, with a note about data blocks from widgets not being calculable or editable. On the right, options to choose the planning scenario labeled 'Budget 2027,' select a planning period from January to December 2027, and pick the plan structure either starting with an empty plan or creating one from a report widget. Below are expandable sections with financial reports including revenue, profit, operating results, balance sheet, cash flow, management reporting, and team reports.

Start planning with real numbers, not zeros

Build your plan straight from an existing report, like your P&L or balance sheet. Helu carries over the right data blocks automatically, so you begin with a meaningful baseline instead of a blank page.
Automatic Data Blocks
Built from Existing Reports
Meaningful Baseline
Autofill
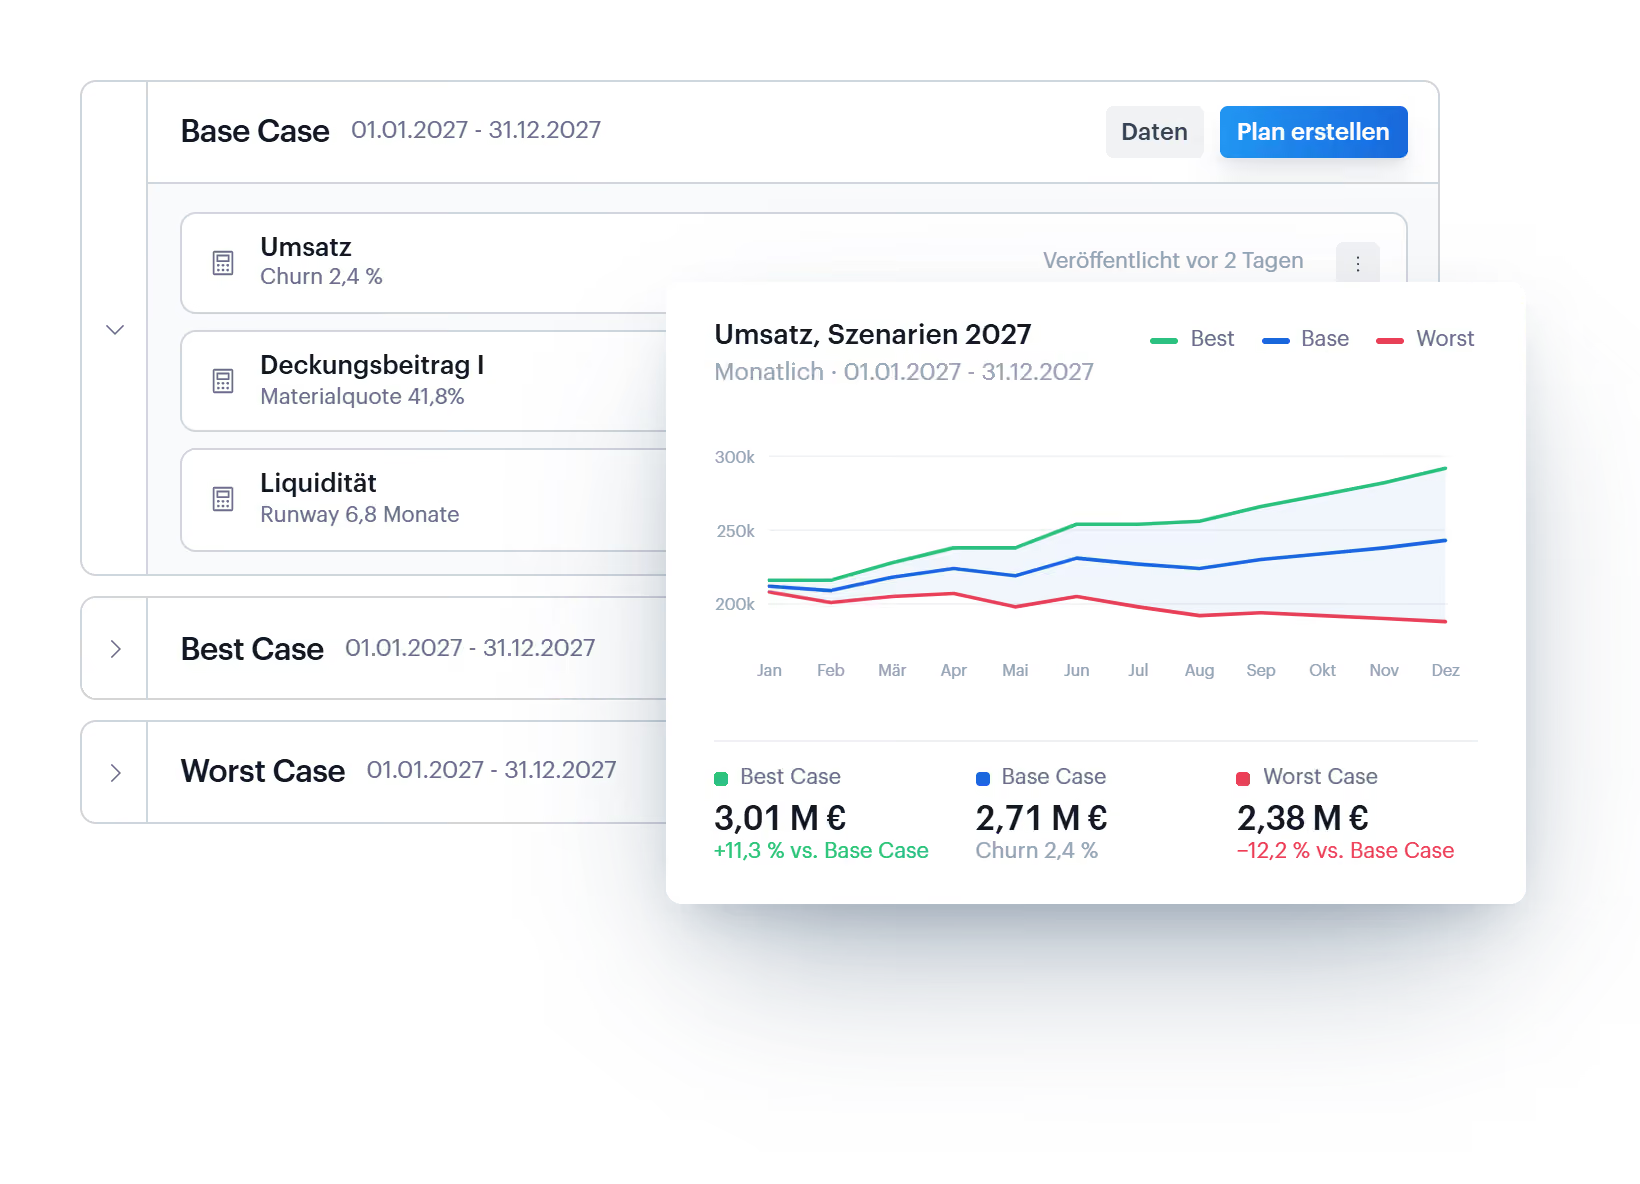
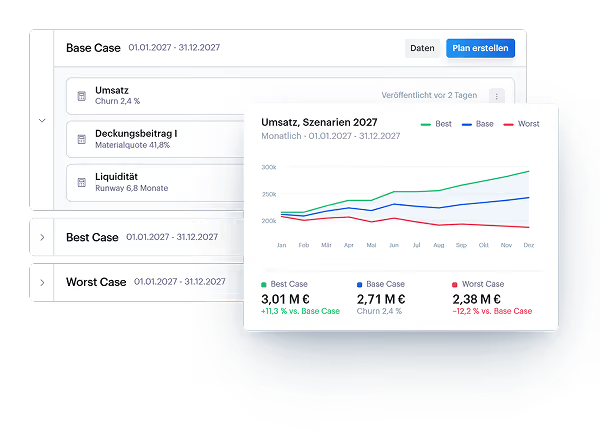
Dashboard showing 2027 sales scenarios from January to December with line graphs for Best Case, Base Case, and Worst Case. Best Case line is green and peaks near 300k, Base Case is blue near 250k, and Worst Case is red near 200k. Below the graph, sales values and comparisons are listed: Best Case at 3.01 million euros (+11.3% vs Base Case), Base Case at 2.71 million euros with 2.4% churn, and Worst Case at 2.38 million euros (-12.2% vs Base Case). Other metrics shown are churn rate, contribution margin I with material quota, and liquidity runway in months.
Interface screen showing financial scenarios for 2027 with three cases: Best Case, Base Case, and Worst Case, each displaying monthly revenue trend lines from January to December. Best Case revenue reaches about 3.01 million euros with +11.3% vs Base Case; Base Case is 2.71 million euros with 2.4% churn; Worst Case is 2.38 million euros, -12.2% vs Base Case. Also shown are details for Base Case including churn 2.4%, material share 41.8%, and liquidity runway 6.8 months.

Plan for every outcome with multiple scenarios

Build your Base Case, Best Case, and Worst Case side by side, or create your own custom scenario. Compare assumptions in parallel and see how each one plays out before committing.

Base / Best / Worst Case
Custom Scenarios
Parallel Comparison

„Seitdem sich unsere Buchhaltung im Haus befindet und wir unseren Controlling-Workflow dank Helu optimieren konnten, konzentriert sich die Zusammenarbeit mit unserer Steuerberatungskanzlei viel mehr auf den wesentlichen Part der Beratung und Unterstützung.“

Zuhair Rajab

Senior Controller, Sanity Group

"Mit Helu konnten wir viele Lohnnebenkosten einsparen, weil wir nun einen genaueren Einblick in z.B. die Spesen oder Reisekosten unserer Mitarbeiter haben und Vergleiche anstellen können."

Patrick Meisberger

CommerzVentures

"Wenn wir von der Finalisierung unserer Monatsabschlüsse sprechen, hatten wir oft Probleme den 15. als Stichtag einzuhalten. Jetzt sind wir oft schon am 10., manchmal sogar früher fertig. Für uns hat sich unser Arbeitsaufwand halbiert - 50% mehr Zeit, die wir in die viel wichtigere Analyse und Optimierung unserer Finanzflüsse stecken können."

Jessie Zepke

Finanzmanager, Sanity-Gruppe

"Meine Arbeitsbelastung hat sich stark verringert, vor allem bei den Quartalsberichten. Früher brauchte ich für einen Bericht ein bis zwei Tage, jetzt schaffe ich ihn in weniger als ein bis zwei Stunden."

Heiko Rahlfs

CFO, wealthpilot

„Helu ist für uns zum zentralen Controlling-Tool geworden. Mit Dutzenden aktiven Nutzer:innen über alle Abteilungen im Lufthansa Innovation Hub ermöglicht uns Helu eine klar strukturierte, transparente und jederzeit aktuelle Sicht auf unsere Finanzzahlen. Die Kombination aus intuitiver Bedienung, hoher Datenqualität und der Geschwindigkeit, mit der wir Reports und Szenarien erstellen können, hat unseren Controlling-Prozess nachhaltig verbessert.“

Lufthansa Innovation Hub

With Helu, we create plan-actuals comparisons on a cost center basis, without any manual steps. We work with real data booked in DATEV, which is always up to date: a major advantage, as we previously had to make many tedious adjustments in Excel. Another decisive factor for us was that Helu can be easily adapted to our needs without the complexity of other tools.

Ignite by Hella Forvia

„Seitdem sich unsere Buchhaltung im Haus befindet und wir unseren Controlling-Workflow dank Helu optimieren konnten, konzentriert sich die Zusammenarbeit mit unserer Steuerberatungskanzlei viel mehr auf den wesentlichen Part der Beratung und Unterstützung.“

Zuhair Rajab

Senior Controller, Sanity Group

"Mit Helu konnten wir viele Lohnnebenkosten einsparen, weil wir nun einen genaueren Einblick in z.B. die Spesen oder Reisekosten unserer Mitarbeiter haben und Vergleiche anstellen können."

Patrick Meisberger

CommerzVentures

"Wenn wir von der Finalisierung unserer Monatsabschlüsse sprechen, hatten wir oft Probleme den 15. als Stichtag einzuhalten. Jetzt sind wir oft schon am 10., manchmal sogar früher fertig. Für uns hat sich unser Arbeitsaufwand halbiert - 50% mehr Zeit, die wir in die viel wichtigere Analyse und Optimierung unserer Finanzflüsse stecken können."

Jessie Zepke

Finanzmanager, Sanity-Gruppe

"Meine Arbeitsbelastung hat sich stark verringert, vor allem bei den Quartalsberichten. Früher brauchte ich für einen Bericht ein bis zwei Tage, jetzt schaffe ich ihn in weniger als ein bis zwei Stunden."

Heiko Rahlfs

CFO, wealthpilot

„Helu ist für uns zum zentralen Controlling-Tool geworden. Mit Dutzenden aktiven Nutzer:innen über alle Abteilungen im Lufthansa Innovation Hub ermöglicht uns Helu eine klar strukturierte, transparente und jederzeit aktuelle Sicht auf unsere Finanzzahlen. Die Kombination aus intuitiver Bedienung, hoher Datenqualität und der Geschwindigkeit, mit der wir Reports und Szenarien erstellen können, hat unseren Controlling-Prozess nachhaltig verbessert.“

Lufthansa Innovation Hub

Are you ready to join?